Does Floor-Kelly Help Savers and Retirees?
In history, full floor-Kelly added Bitcoin on top of monthly buying: a median 1.10× the Bitcoin of DCA into Bitcoin over 48 months. In simulated futures with the floor refit inside each path, that edge did not continue (0.90×). For a retiree starting at a cycle top, half floor-Kelly protected the portfolio, mainly by holding less Bitcoin.
Floor-Kelly With Money In and Money Out
Contributions, withdrawals and partner assets for a floor-anchored Kelly rule
The Question
Paper 19 tested a Kelly rule whose growth input is the growth from today’s price to the power-law floor four years ahead. It tested a lump sum: money in once, nothing added, nothing taken out.
Real investors add money while they work and take it out when they stop. So this paper asks two things. Does the rule’s timing still add Bitcoin on top of monthly buying? And does it help a retiree survive a bad start?
It also compares the floor input with three others (the historical average return, the trend’s growth rate, and the trend itself as the target), at full, half and quarter Kelly, with gold, cash or US stocks next to Bitcoin.
The evidence comes from walk-forward history (2012 to 2026) and from 30-year simulated futures (16 cases, 2,000 paths each) in which price can stay below the floor. History has about three independent four-year windows and three cycle tops, so it describes rather than tests.
Saving: Money In
In history, full floor-Kelly added Bitcoin on top of DCA. Over every 48-month window from 2012, it ended with a median 1.10× the Bitcoin of putting each contribution into Bitcoin.
The gain is timing, not allocation. Against a constant mix at its own average weights, it gained 1.23× over 48 months and 1.76× over 96 months.
In simulation, with the floor refit inside each path, that edge does not continue. Full floor-Kelly ended 20 years of DCA at a median 0.90× in the base world, with outcomes widely spread (10th to 90th percentile 0.18× to 3.57×). It ended below 1 in four of five worlds.
| 20-year DCA, world | Floor-Kelly, refit | Floor-Kelly, frozen | Trend-anchored |
|---|---|---|---|
| BASE (cycles as fitted) | 0.90× | 3.34× | 4.40× |
| DAMPED (shocks halved) | 0.75× | 0.85× | 1.51× |
| FADING (shocks fade) | 0.45× | 1.28× | 1.97× |
| NO_REVERSION (random walk) | 0.15× | 1.00× | 1.00× |
| BROKEN (half the trend growth) | 3.01× | 4.34× | 4.85× |
Median Bitcoin at the end of 20 years of DCA from today, against DCA into Bitcoin. Full Kelly, Bitcoin with gold, 2,000 paths per world. Refit: the floor is refit inside each path; frozen: held at its October 2026 fit.
Why: simulated crashes go deeper than history’s. In the base world 16% of months sit below the published floor, against 2% in 2012 to 2026. Each crash that sets a new low pulls the refit floor down, from 0.45× the trend today to about 0.24× after 25 years. Measured from that lower floor, the rule’s growth input is smaller, and it holds less Bitcoin.
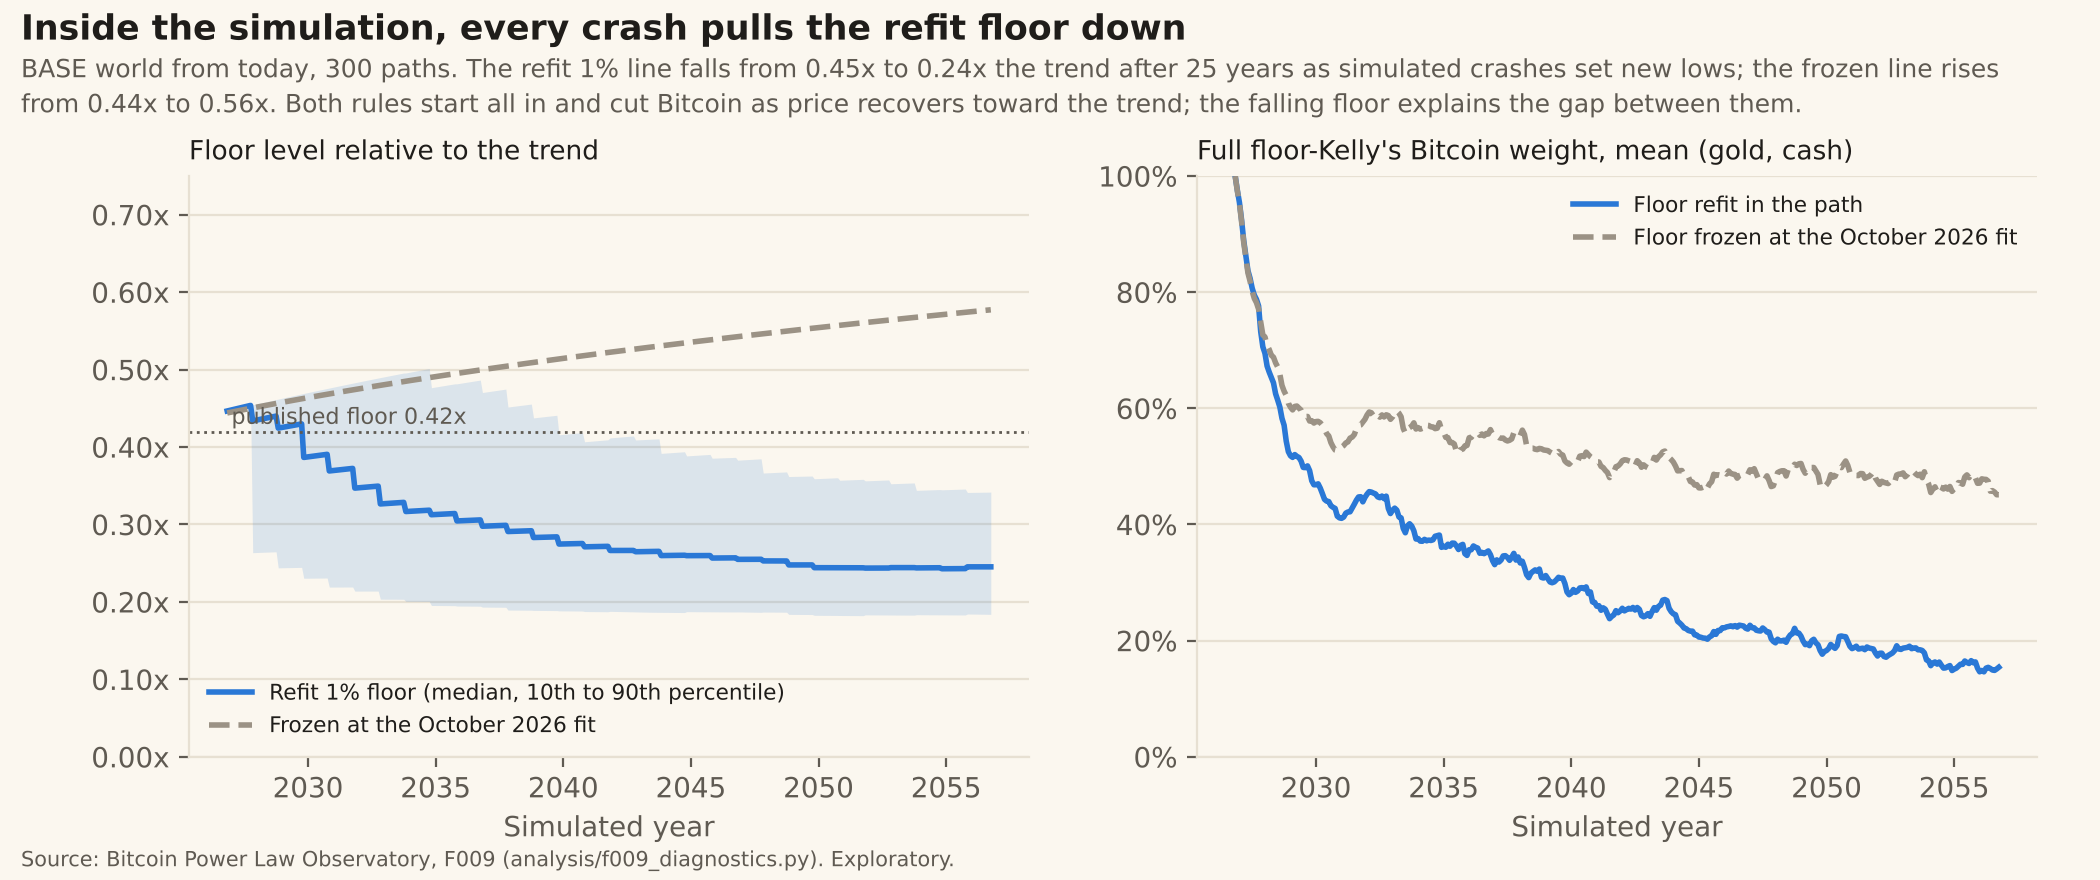
Trend-anchored Kelly led most simulated cases, but much of that lead is built in: its starting target equals the model’s own four-year forecast (0.898× trend). In history it trailed floor-Kelly at full Kelly (1.04× against 1.10×).
Retiring: Money Out
From 2012 to 2026 almost any start survived almost any withdrawal rate, because Bitcoin rose roughly 10,000-fold. The informative cases are retirements at a cycle top.
| Retire at the top | Highest rate survived | Lowest real value at 8% |
|---|---|---|
| November 2013 | 9.7% / 19.1% | 11% / 44% |
| December 2017 | 12.3% / 20.0% | 19% / 56% |
| October 2021 | 12.6% / 20.8% | 19% / 51% |
Each cell: Bitcoin only / half floor-Kelly, with gold and cash. $1M at the close of the top month, withdrawals indexed to inflation, to October 2026 (12.9, 8.8 and 5.0 years). These are survival rates over those windows, not 30-year rates.
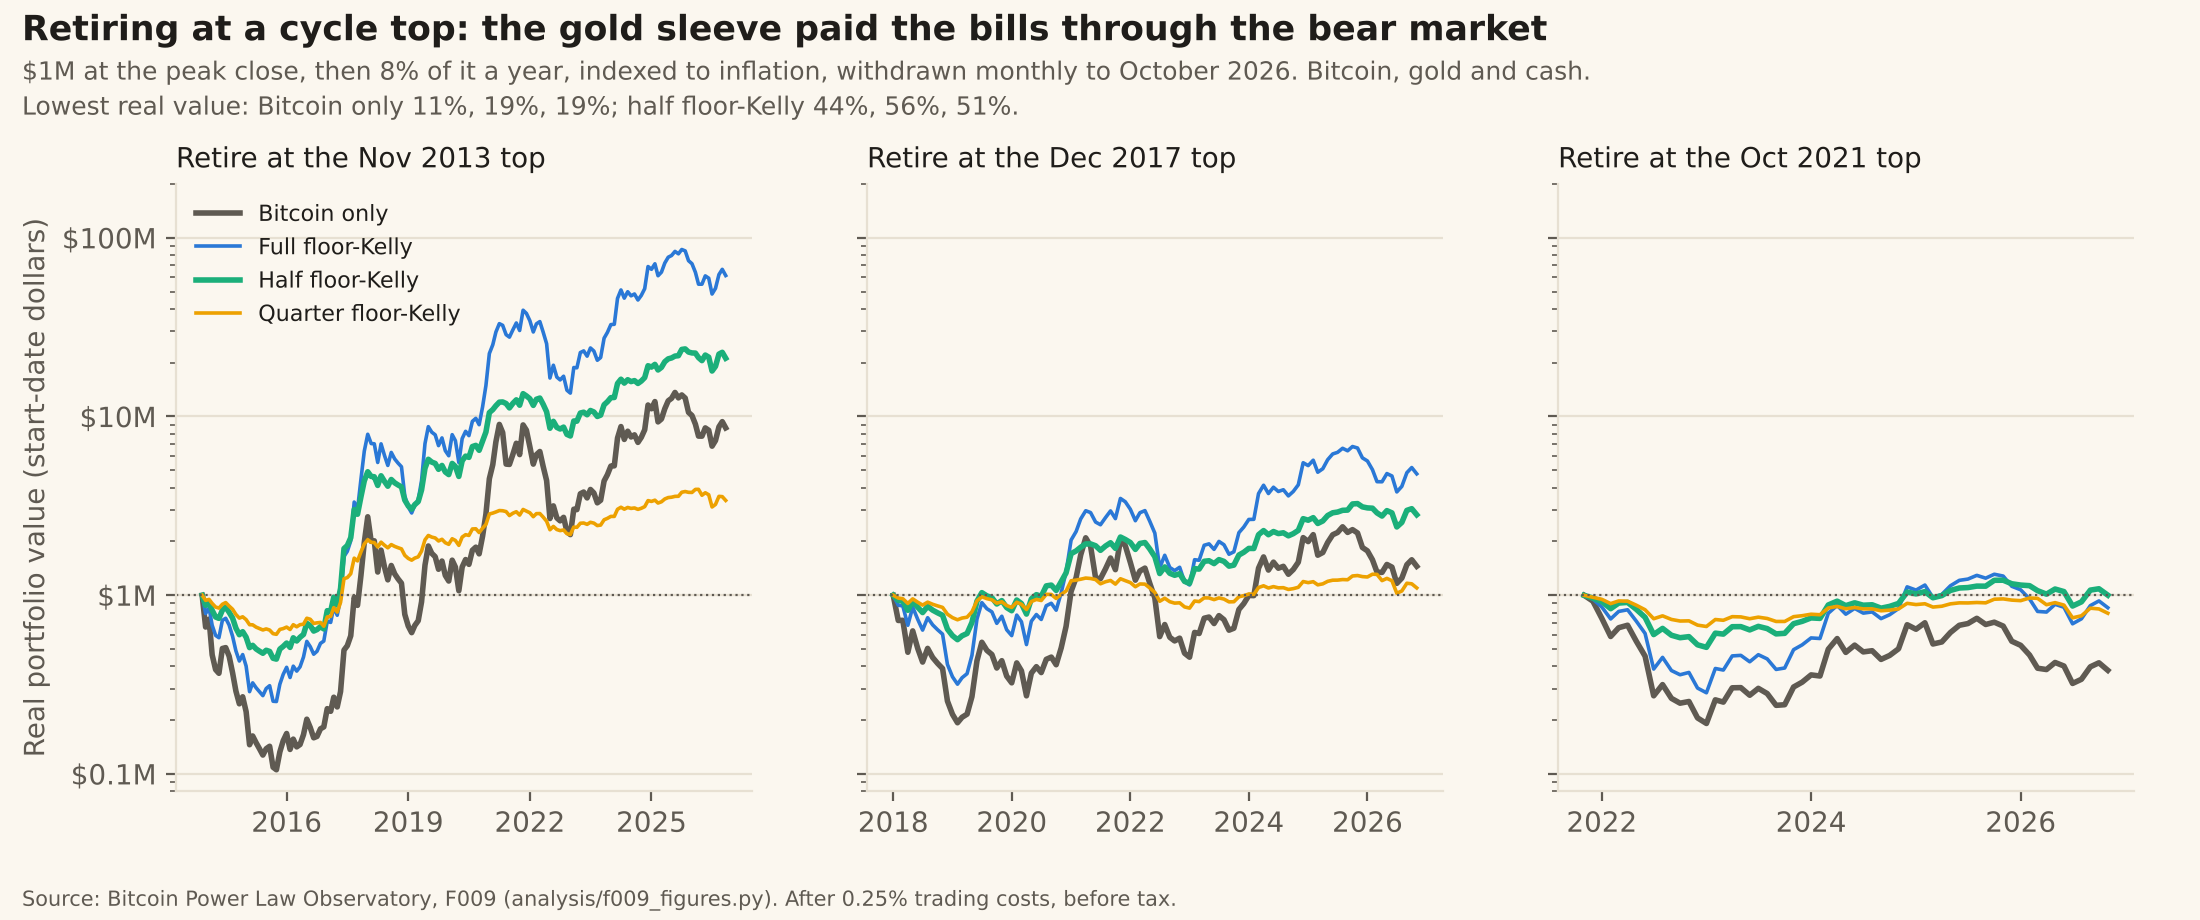
The protection came mainly from holding less Bitcoin. At each top half floor-Kelly held only 23% to 29% Bitcoin. In simulation from 2.5× trend it beat Bitcoin only by 2.0 points of safe withdrawal rate with cycles intact and 3.5 points with trend growth halved, but by only 0.5 points with cycles fading. A constant mix at its own average weights came within half a point of it in all three worlds, and a fixed 50/50 Bitcoin and gold mix did as well or better in all three. The test that history and simulation agree here was adapted after the results were known.
Retiring today, near the floor, Bitcoin only did better. In the base world its 30-year safe withdrawal rate (95% of paths survive) was 19.5%, against 10.5% for half floor-Kelly.
These rates are high because the model assumes the power law holds (a median 480× rise in 30 years). With trend growth halved, Bitcoin only’s rate was 9.5%. In a random walk around the trend, Bitcoin only had no safe rate.
What a Reflecting Floor Assumed
Papers 15 to 17 estimated Bitcoin withdrawal rates in models that bounced price off a floor at 0.432× trend. Price can and does close below the floor. This study lets it stay there as long as the shocks take it, then runs the same shocks with the bounce added.
| Bitcoin only, start | No reflection | Reflecting |
|---|---|---|
| Starting today, near the floor | 19.5% | 30.0% |
| Starting at 2.5× trend | 5.0% | 6.5% |
30-year safe withdrawal rate (95% of paths survive), base world, same shocks. Reflecting: price bounced off 0.432× trend.
A reflecting floor flatters Bitcoin retirement. It adds about 10 points from today, and about 30% more from a peak. The withdrawal figures in Papers 15 to 17 rest on that assumption.
A later study (Paper 23) corrected Paper 16 without it. In Paper 16’s own model, at its own start (the trend), a holder’s safe spending at 99% confidence fell from 103.6% to 46.1% of the floor’s growth. Its 80% “endowment” tier carried 12.3% ruin over 30 years instead of 0%. Paper 15’s figures, and any in Paper 17, have not yet been rerun.
History sits between the two models. Since 2012, price spent 2.3% of days below the published floor, and its longest stay was 66 days. The base simulation spends 16% of months below it; the reflecting model spends none.
What Holds, and What Does Not
Where history and simulation agree:
- Savers did better with full floor-Kelly than with half or quarter floor-Kelly, at every risk aversion tested, in history and in four of five simulated worlds.
- A retiree starting at a top did better with half floor-Kelly than with Bitcoin only, mainly because it held less Bitcoin.
Where they disagree: whether to aim Kelly at the floor or at the trend. The trend led in simulation, the floor in history. The paper makes no recommendation there.
“Normal” Kelly is close to Bitcoin only. Fed Bitcoin’s average return since 2010, it held 100% Bitcoin at full Kelly and 90% on average at half Kelly.
Stocks beat gold and cash as the partner, but only at 2012 to 2026 returns. With stock returns cut to 7% a year, cash led.
The floor zone was a 12-month buying signal in history. From below 1.25× the walk-forward floor, every 12-month return was positive (36 of 36). Over 48 months, against the trend’s own growth, it was a coin flip (16 of 32). This rests on three or four bear markets.
| Pre-registered test | Verdict |
|---|---|
| P1: full floor-Kelly beats DCA into Bitcoin | Mixed: history passes, simulation fails |
| P2: half floor-Kelly helps a retiree starting today | Not supported |
| P3: floor-Kelly ranks first among Kelly inputs | Mixed: first at full Kelly in history, last in simulation |
| P4: the best partner asset | Stocks, sample-dependent |
| P5: the floor as a buying signal | Supported |
Read the Paper
36 pages, 16 figures, version 1.4. The method, the four Kelly inputs, saving and retiring in walk-forward history, 16 simulated cases, the partner assets, the reflecting-floor comparison, the scorecard against the pre-registered plan and every deviation from it.
The floor’s caution paid in history but not in a future of deeper crashes, and at a top it protected a retiree mostly by holding less Bitcoin.