What Can a Bitcoin Retiree Spend, and What Should They Sell?
From today’s price, a holder can safely spend between 50% and 110% of the floor’s yearly growth, depending on which future comes: a range, not a rate. Paper 16’s 80% tier assumed the price bounces off the floor; without that bounce it carries 12% ruin in Paper 16’s own model. What to sell is a ladder that sells into euphorias and buys back at or below the trend. It costs nothing without a euphoria and leaves about twice a holder’s Bitcoin after one.
Retiring on Bitcoin Without a Reflecting Floor
Safe spending is a range, not a rate, and a sell ladder pays only if euphorias return
The Question
A Bitcoin retiree needs two answers: how much can I spend, and what do I sell to pay for it?
Paper 16 proposed spending a share of the floor’s growth, the coverage: the first year’s spending is a share of the dollar rise of the floor (0.42× the power-law trend) over the next 12 months, then rises with inflation. It found 80% coverage “functionally” free of ruin. But its model let the price bounce off the floor, and the floor is a level, not a wall.
This paper reruns Paper 16’s claims without that bounce, in Paper 16’s own engines and in the twelve simulated worlds of Paper 21 and Paper 22 (2,000 paths each), and tests what to sell under a decision rule registered before any test ran.
How Much Can You Spend?
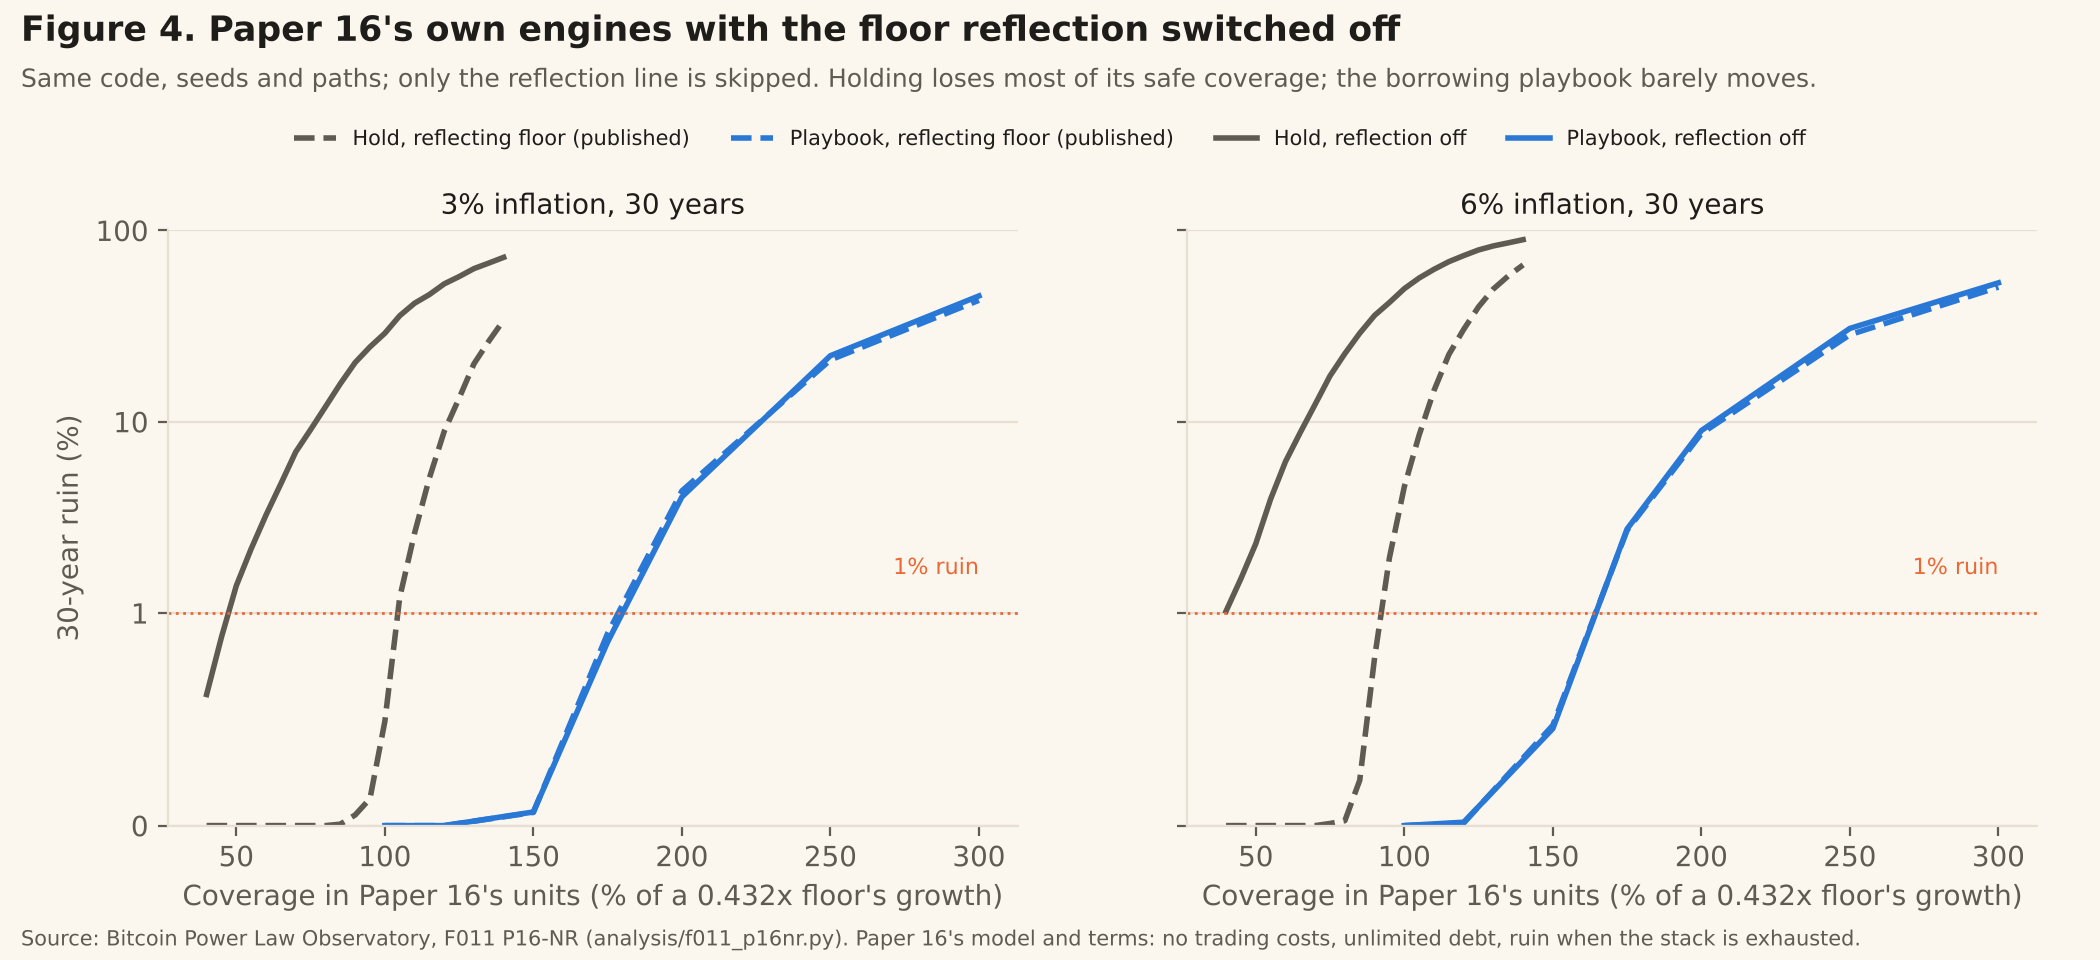
Without the bounce, Paper 16’s tiers fail at its own start. Same code, same seeds, same paths, only the reflection switched off: a holder’s safe coverage (at most 1% ruin over 30 years) falls from 103.6% to 46.1%, and the 80% tier’s ruin rises from 0.00% to 12.3%.
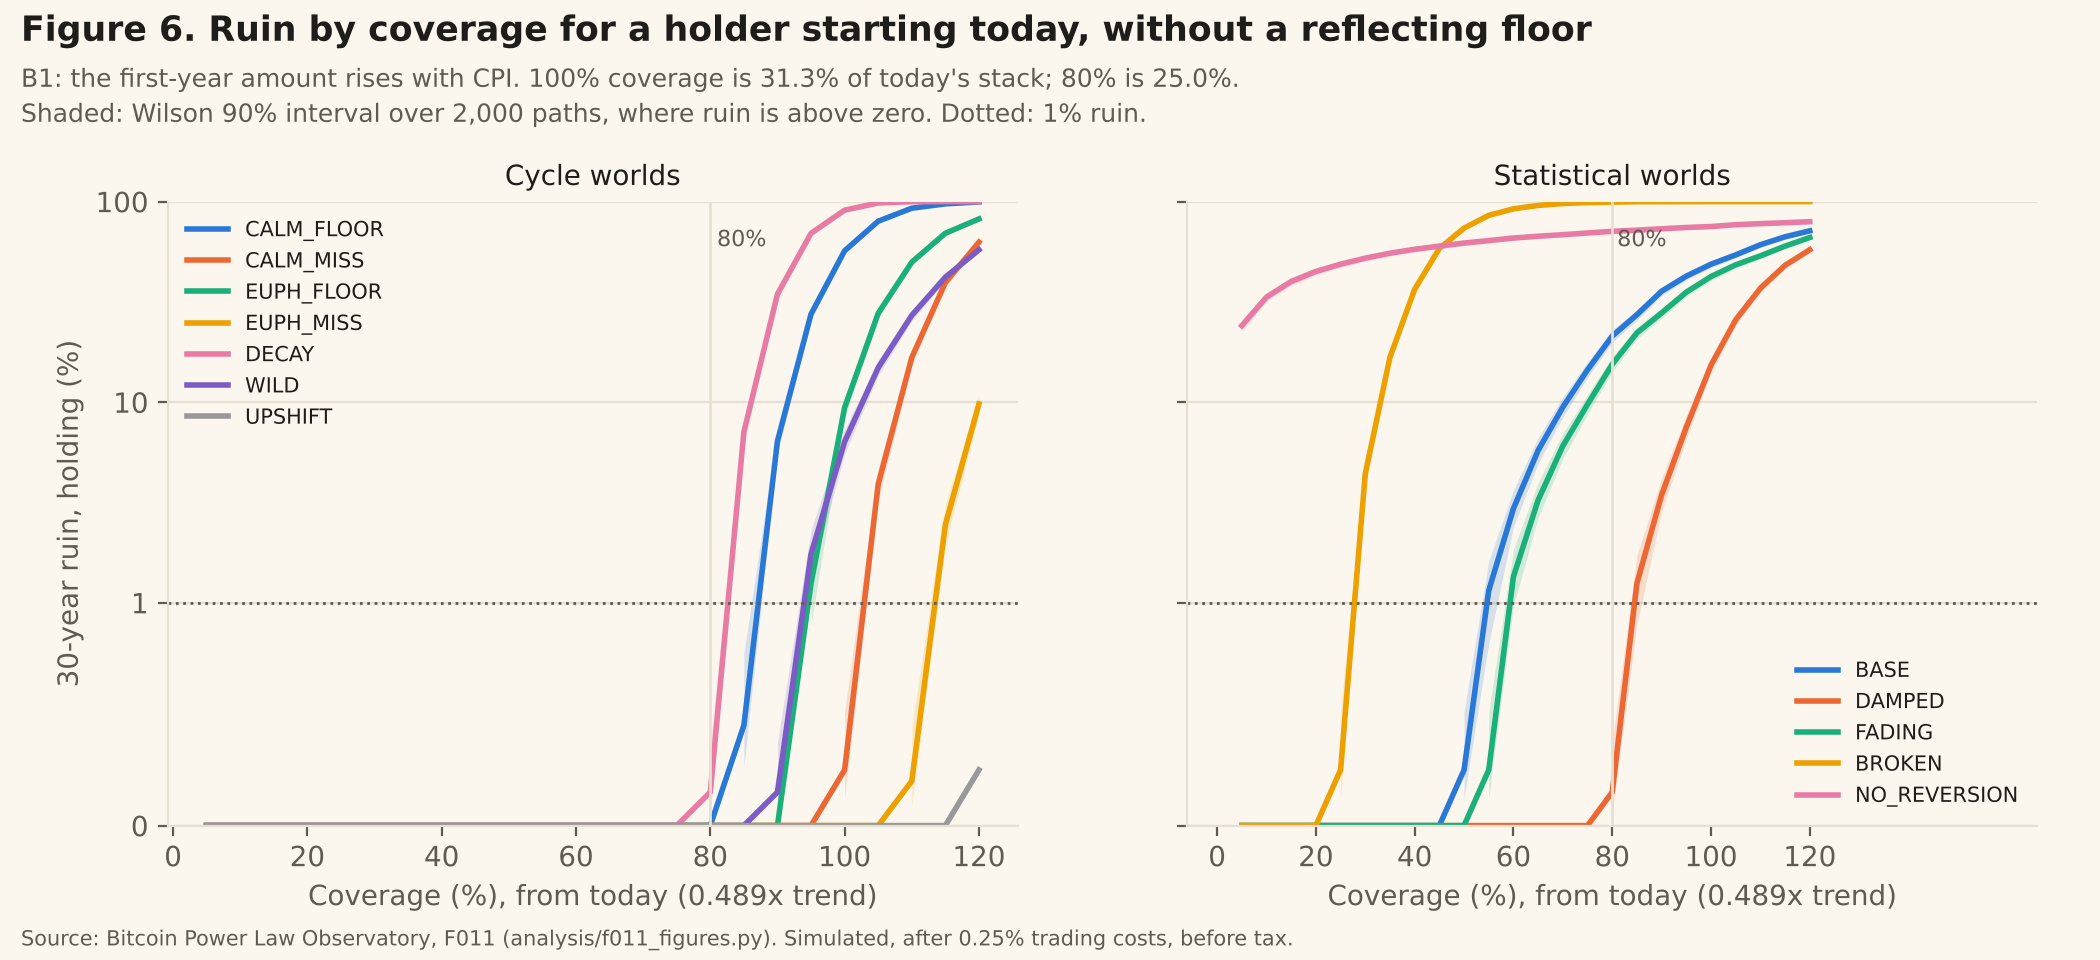
From today’s price, about half the trend, the safe coverage depends on the future:
| World, starting today | Safe coverage (at most 1% ruin) |
|---|---|
| Cycle worlds (history’s four cycle shapes) | 80% to 110% |
| Statistical worlds (a fitted model) | 50% to 80% |
| The trend breaks | 25% |
| A random walk around the trend | none |
80% coverage is about $19,300 a year per Bitcoin, a quarter of today’s stack in the first year. It is safe where the price rebounds from the floor as it has in history, and carries 21% and 15% ruin in the statistical worlds BASE and FADING.
Paper 16’s borrowing playbook does not depend on the bounce inside its own model, because it never sells low: it borrows. That model lets debt grow without limit. In this paper’s worlds, with debt counted, the playbook owed more than it owned on 14% to 22% of paths at 150% coverage from the trend.
What to Sell
Eight rules were compared at the spending a holder can just afford in each world: holding, a two-year cash buffer, four euphoria-funded reserves, half floor-Kelly and Paper 22’s sell ladder. The registered rule picked the ladder, L2-R1, as the only winner from today, from the trend and from a peak.
buy back at the trend
Bitcoin kept against a holder, 10 to 14 years out, at a holder’s safe spending. Extra safe spending is the average gain in safe coverage over the scored worlds, in percentage points.
No euphoria costs nothing. In the calm worlds the ladder traded on fewer than 0.5% of paths. One euphoria pays, mostly in Bitcoin kept rather than in spending: its gain in safe coverage is small.
Its lead needs daily orders. With trades only at month-end its score falls from 0.773 to 0.500, though it still passes every gate. Almost three quarters of its score comes from the statistical worlds, three of which swing wider than history.
Against the Rivals
Paper 22 had found three rules close to the ladder, or ahead of it where it is weak. A registered addendum, F011-R, ran them under the same spending, worlds and decision rule.
| Rule | Score from today | Month-end fills |
|---|---|---|
| L2-R3: the ladder, buying back in thirds at 1.0×, 0.75× and 0.5× trend | 0.806 | 0.566 |
| L2-R1: the ladder, buying back all at the trend | 0.773 | 0.500 |
| L2-RP: the ladder, buying back at half each sale price | 0.700 | 0.477 |
| Trend-anchored Kelly (trades at month-end) | 0.648 | 0.648 |
Score: a weighted average, over eleven worlds, of the log of Bitcoin kept against a holder; 0 is the same as holding.
From today, the registered rule now recommends L2-R3. It wins clearly within the simulation (90% interval for the gap 0.027 to 0.040) and adds the most safe spending (+5.6 points). The lead is narrow in every other sense. L2-R1 is recommended from the trend and from a peak, with wider intramonth swings, and at lower spending. L2-R3’s edge comes from two euphoria worlds and the world where the trend breaks; where the price stops at the trend, its deeper orders wait for falls that do not come.
The two differ only in where they buy back. Either is a defensible choice; which comes first depends on the start and on which futures you believe.
Where It Is Weak
If multiples ratchet up, the trend buy-back is not reached and the cash sits idle for decades: at year 30 the ladder holds a median 0.04 Bitcoin-equivalent against a holder’s 0.19. In a random walk, on the worst tenth of paths the price runs away after it has sold, and it keeps about 3% of a holder’s Bitcoin.
| Stress world | L2-R1 | L2-R3 | L2-RP |
|---|---|---|---|
| Random walk: Bitcoin kept, years 10 to 14 | 0.68× | 0.74× | 0.97× |
| Multiples ratchet up: Bitcoin-equivalent at year 30 (holder 0.19) | 0.04 | 0.05 | 0.54 |
L2-RP is the robust one, as Paper 22 found. It scores lower overall, but it is the ladder to prefer if you doubt that the price keeps returning to the trend.
Buffers and Borrowing
- A cash buffer bought at today’s price is ruinous at a holder’s spending. Two years of spending is 31% to 69% of the stack; it was ruined on 6% to 100% of paths in seven of nine core worlds.
- Three of four euphoria-funded reserves passed the risk gates but scored far lower, and rarely reached the owner’s targets for covering a drawdown.
- Half floor-Kelly holds too little Bitcoin to pay a holder’s spending.
- Borrowing at the floor (tested separately, never recommended) adds 25 to 35 points of safe coverage where stays below the floor are short, nothing where they are long, and margin calls where the trend breaks.
History
History describes; it does not decide. On walk-forward lines to October 2026, the start matters more than the rule:
- From the 2016 halving, holding and the ladder both survived 110% coverage.
- From the 2017 top, the ladder survived at least 300% against holding’s 155%.
- From late 2012, holding (145%) beat the ladder (65%).
Taxes are out of scope; every ladder sale may be taxable. The results are simulated, after 0.25% trading costs.
Read the Paper
68 pages, 11 figures, version 1.4. Paper 16 without the bounce, safe spending in twelve worlds and three starts, eight rules for what to sell, the borrowing arm, other spending rules, every sensitivity, walk-forward history and the scorecard against the pre-registered predictions. The F011-R addendum (16 pages) has the rivals.
Spend a range, not a rate, and sell into euphorias: the ladder costs nothing if none comes and pays if one does.