Did the Power Law Hold in Real Time?
We refit the formula every month since 2011, using only the prices known at the time. The exponent settled in 2016. But a 0.42× floor drawn in real time held afterwards in only 13% of months. A floor at 0.30× held in 98%.
The Formula, Month by Month
184 real-time refits of Bitcoin’s power law, 2011 to 2026
Latest monthly check: October 2026: the formula holds. The numbers
The Question
Every power-law chart shows one line through all the data. That line is the best description of the past. Nobody could have drawn it in 2015, 2018 or 2022.
So we asked a different question: what did the formula look like at the time, and would its floor have held?
For every month-end from July 2011 to October 2026 we refit log10(price) = a + b × log10(days since 3 January 2009) on the closes known that day. 184 formulas. Then we tested each one on everything that came after it.
The Exponent Settled in 2016
Before 2016 the exponent jumped anywhere from 5.50 to 12.28. Every refit since January 2016 lies between 5.56 and 5.99. The published 5.688 sits inside that band.
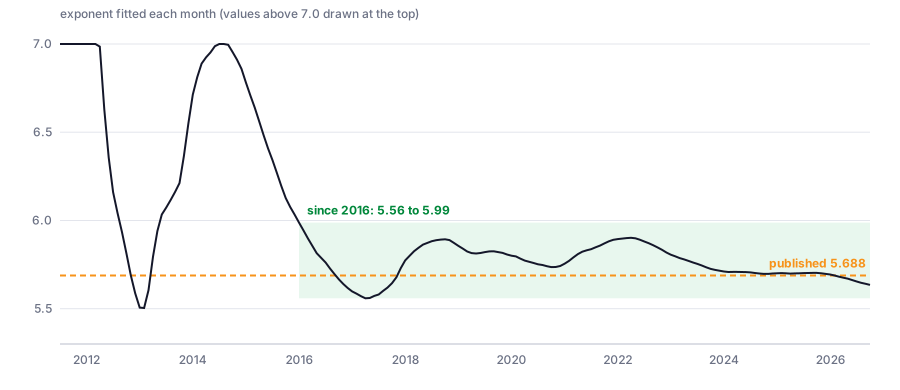
That is what a real regularity looks like as data arrives. A spurious fit keeps drifting. The October 2026 refit gives 5.635, the bottom of the band, after a year with price well below trend. It is the number to watch.
What Each Year Said About Today
Take the formula as it stood at each year-end and ask it for the trend on 31 October 2026. The published formula says $157,997.
| Formula as of | Exponent | Its trend for Oct 2026 | Against published |
|---|---|---|---|
| End of 2013 | 6.551 | $688,167 | +336% |
| End of 2014 | 6.859 | $1,269,896 | +704% |
| End of 2015 | 6.033 | $275,858 | +75% |
| End of 2018 | 5.873 | $201,515 | +28% |
| End of 2021 | 5.890 | $204,602 | +29% |
| End of 2025 | 5.697 | $156,155 | −1% |
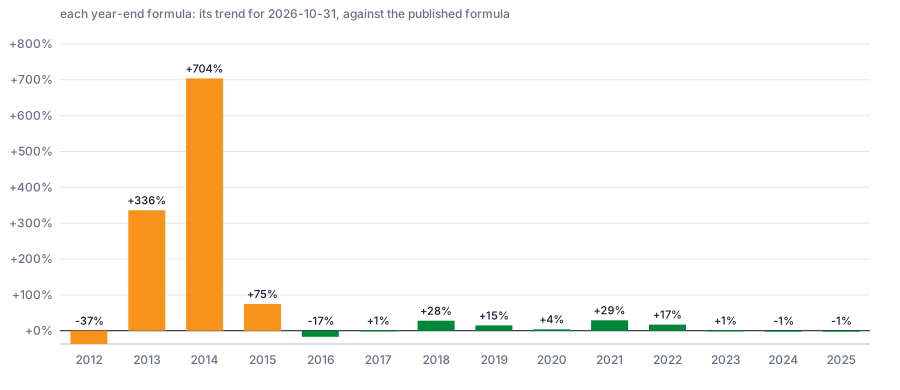
Before 2016 the formula misled a ten-year plan by up to a factor of eight. Since January 2017 every monthly refit lands within −25% and +32%. The misses lean high in the year after a peak: the bubble still pulls the line up where it matters most.
The Real-Time Floor
This is the uncomfortable finding.
On the published formula, the 0.42× floor has been broken on 78 of 4,322 daily closes since 2015: 1.8%. But that formula is fitted with all the data, including the lows it is judged against.
A planner who drew 0.42× on the formula they had at the time saw it broken afterwards in 103 of 118 months since January 2016.
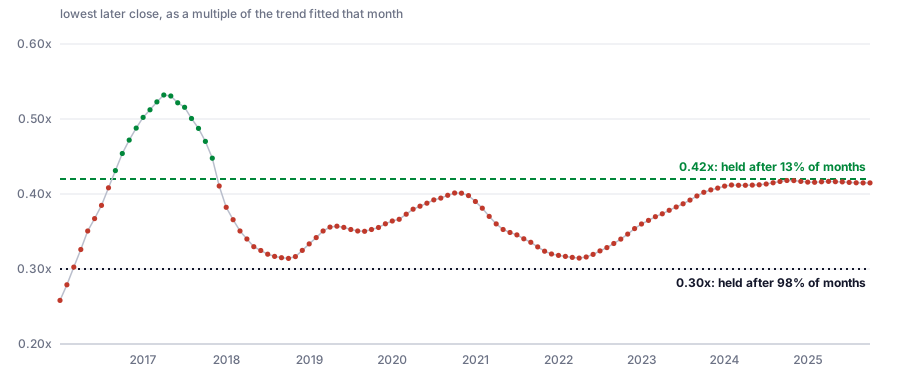
The reason: real-time trends erred by up to a third, and a floor is a fixed fraction of the trend, so it inherits the error. The worst month, January 2016, saw later prices fall to 0.26× its own trend.
The gap has narrowed. Formulas from mid-2023 to late 2025 saw later lows between 0.38× and 0.42× of their own trends, all set by the close of 1 July 2026.
The Monthly Record
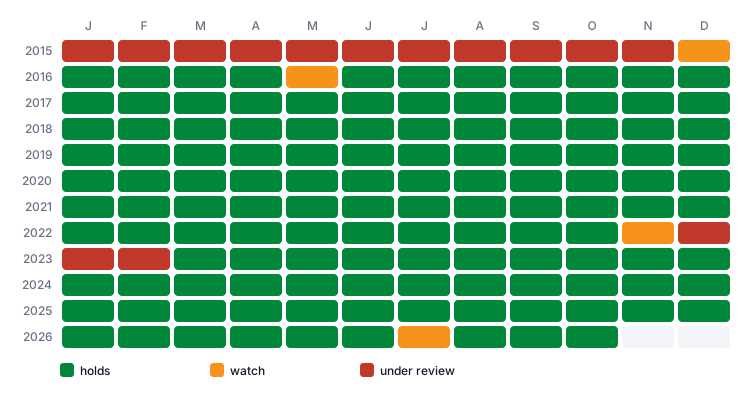
Since November 2026 the site checks the published formula every month. Holds: no close below the floor, and a refit on all data within 25% of the published trend. Watch: either test fails. Under review: the floor broken in two of the last three months, or the refit more than 35% off.
Run back over history: it holds in 124 of 130 months since January 2016. Watch in May 2016, November 2022 and July 2026. Under review from December 2022 to February 2023, after the FTX collapse.
What It Means
The formula is stable. Ten years of monthly refits inside a narrow band. Recent year-end refits within 1.3% of the published trend.
The floor is a level, not a boundary. 98.2% of days above it on today’s fit, 13% of months on a real-time fit. Both are true. They answer different questions.
Plan with a margin. A plan that only works if price never closes below 0.42× trend relies on hindsight. A floor about 30% lower is the stress test this history supports.
Read the Paper
7 pages. Method, all four charts, the full year-end table, the real-time floor test, the verdict rules and the limitations. The charts on this page update every month; the paper’s text stays as published.
A formula that settles as data arrives is a regularity. A floor that held only in hindsight is a level to plan around, not a promise.