Does a Frozen Power-Law Floor Hold?
We fitted four floors at 172 month-ends since 2011, froze them and carried them forward. None held at its nominal rate. Judged the way a floor should be, by time below and recovery, the trend times its lowest-1% multiple passed at 85 of 94 freeze dates.
Freeze It and Carry It Forward
A pre-registered out-of-sample test of four Bitcoin floor definitions, 2011 to 2026
The Question
A floor drawn on Bitcoin’s whole history looks almost unbroken. That says little about a floor drawn at any given date. Nobody in 2017 had the data that fixed today’s line.
So we tested it directly. At every month-end from July 2011 to October 2025 we fitted four floors on the data available that day, froze them, and counted how often price closed below each one afterwards:
- The 1% quantile line, which Paper 19 refits monthly for Kelly sizing;
- the 5% quantile line;
- the trend times its lowest-1% multiple, the fitted trend scaled down to the lowest 1% of closes;
- the trend times 0.42, the published multiple on a trend fitted at the time.
The test and its pass mark were registered before the analysis was run.
No Floor Passed the Pre-Registered Test
The pass mark: after the first full cycle, a median breach rate of at most twice the nominal rate, and no close below the floor for four years at 90% or more of freeze dates. No floor met it.
| Floor, frozen at the time | Median share of later days below | Held 4 years |
|---|---|---|
| 1% quantile line | 13.8% | 5 of 94 |
| 5% quantile line | 21.2% | 2 of 94 |
| Trend × lowest-1% multiple | 0.0% | 72 of 94 |
| Trend × 0.42 | 5.5% | 19 of 94 |
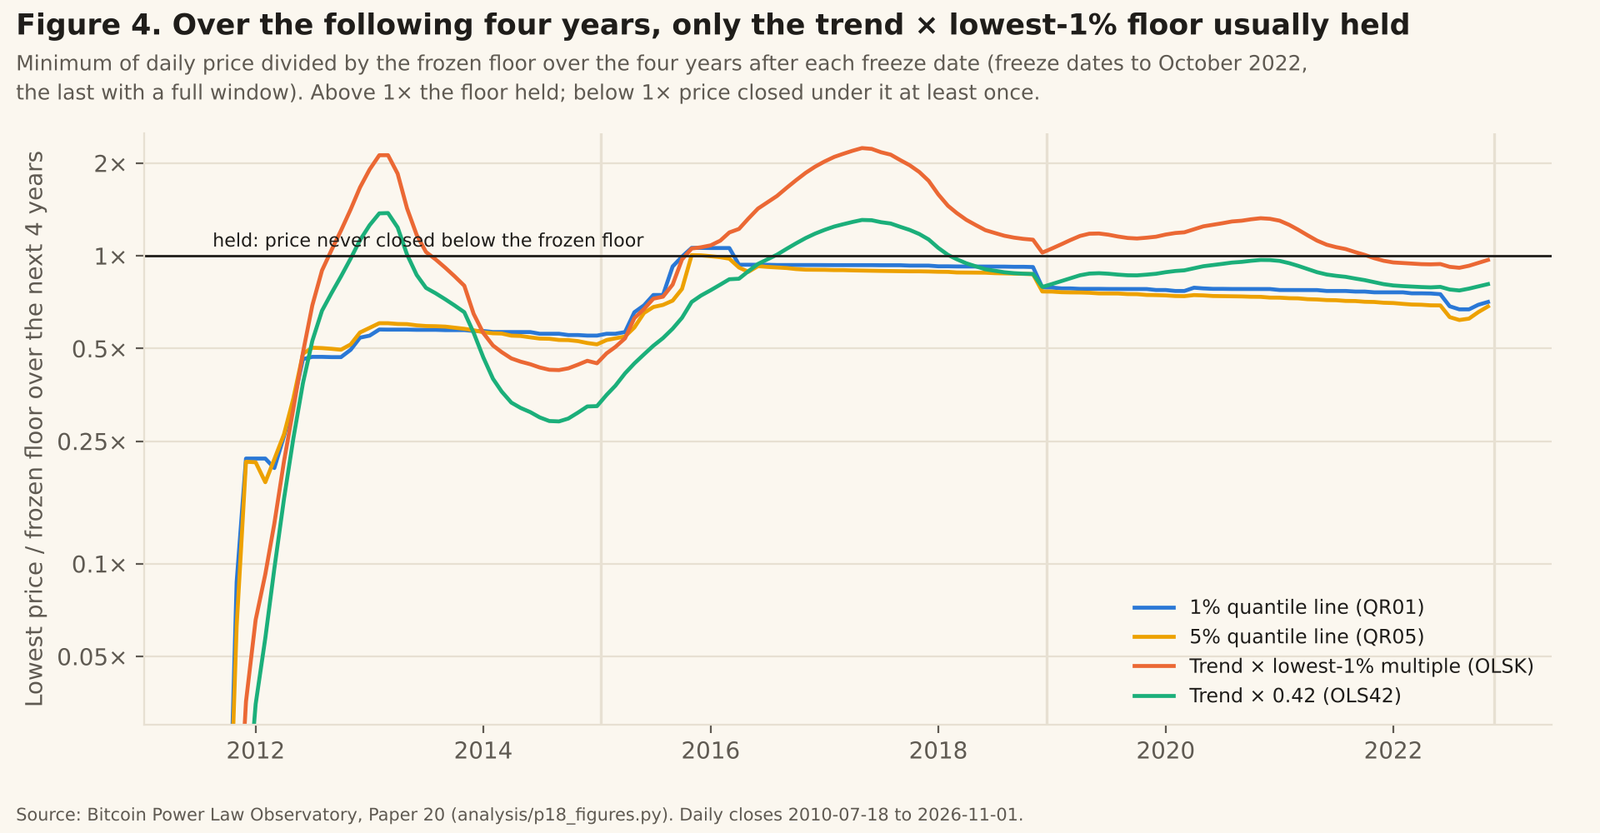
The quantile lines are calibrated in sample and miss out of sample. A 1% line frozen at the time was below price on a median 14% of later days, fourteen times its nominal rate. The deep multiple on the trend held most often, because it leaves room for the trend to be wrong.
The Slope Steps Down in Bear Markets
The 1% line does not drift smoothly. It steps down when a bear market takes price to new lows against it. From 7.25 at the 2011 low to 6.55 at the 2015 low, and 5.95 today. The 2018 bear stayed above the line and left it unchanged.
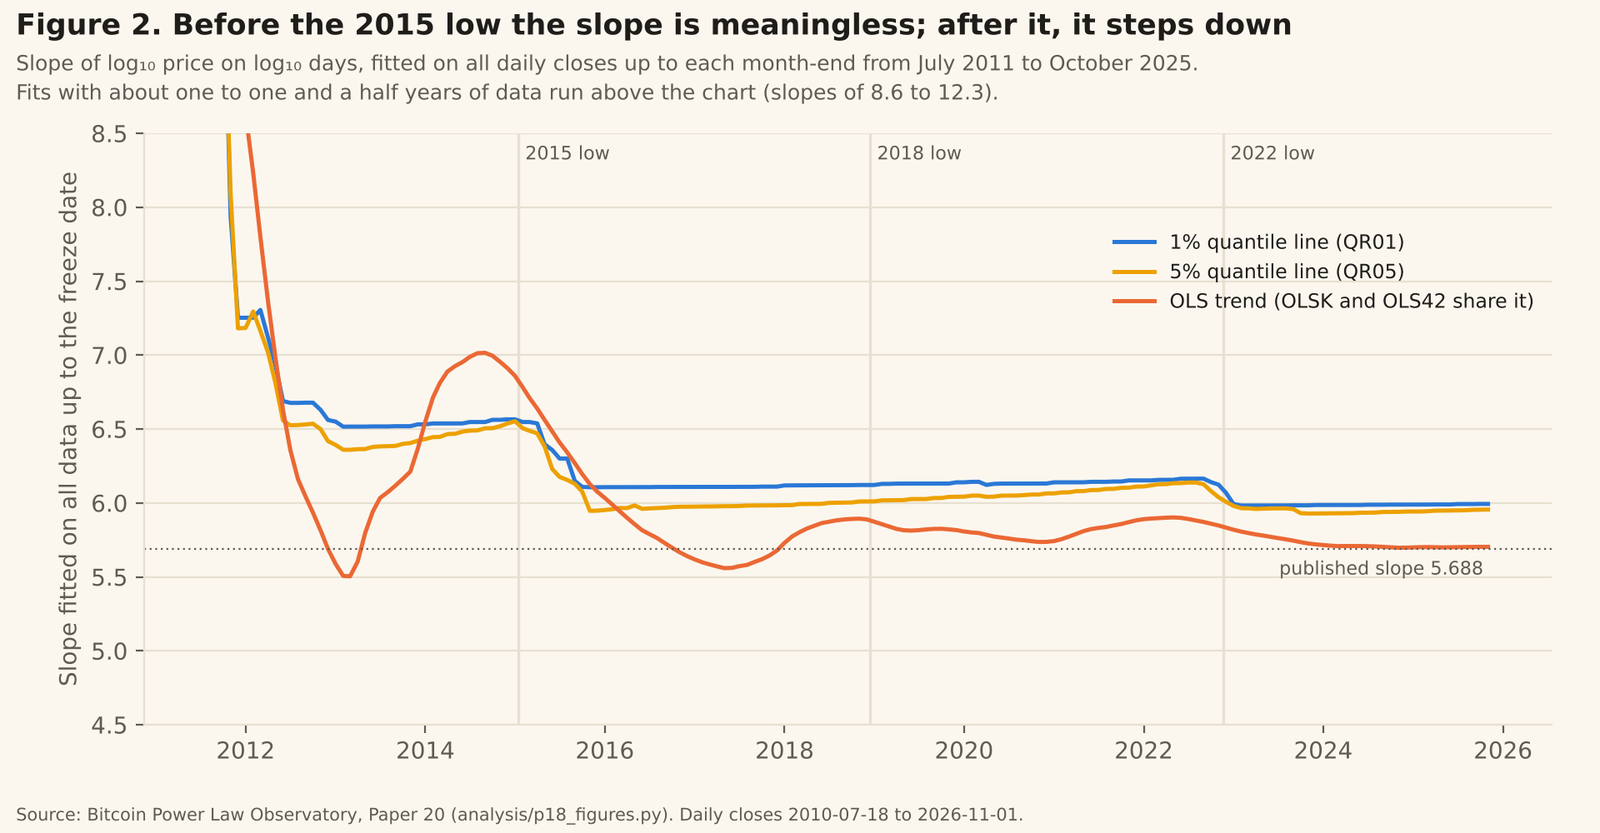
In a walk-forward test, a straight log-log line forecast the next four years better than a bending one at 65% to 82% of forecast dates, and the full-sample curvature is not significant. The Formula, Month by Month (Paper 18) finds the same picture for the trend itself: the exponent settled in 2016, and a 0.42× floor drawn on each month’s own trend held afterwards in only 13% of months.
Judged as a Floor: Time Below and Recovery
“No close below” tests a boundary. A floor is something else: a level price spends little time below and climbs back above quickly. The Observatory standard: at most 5% of days below, and no visit below longer than 180 days.
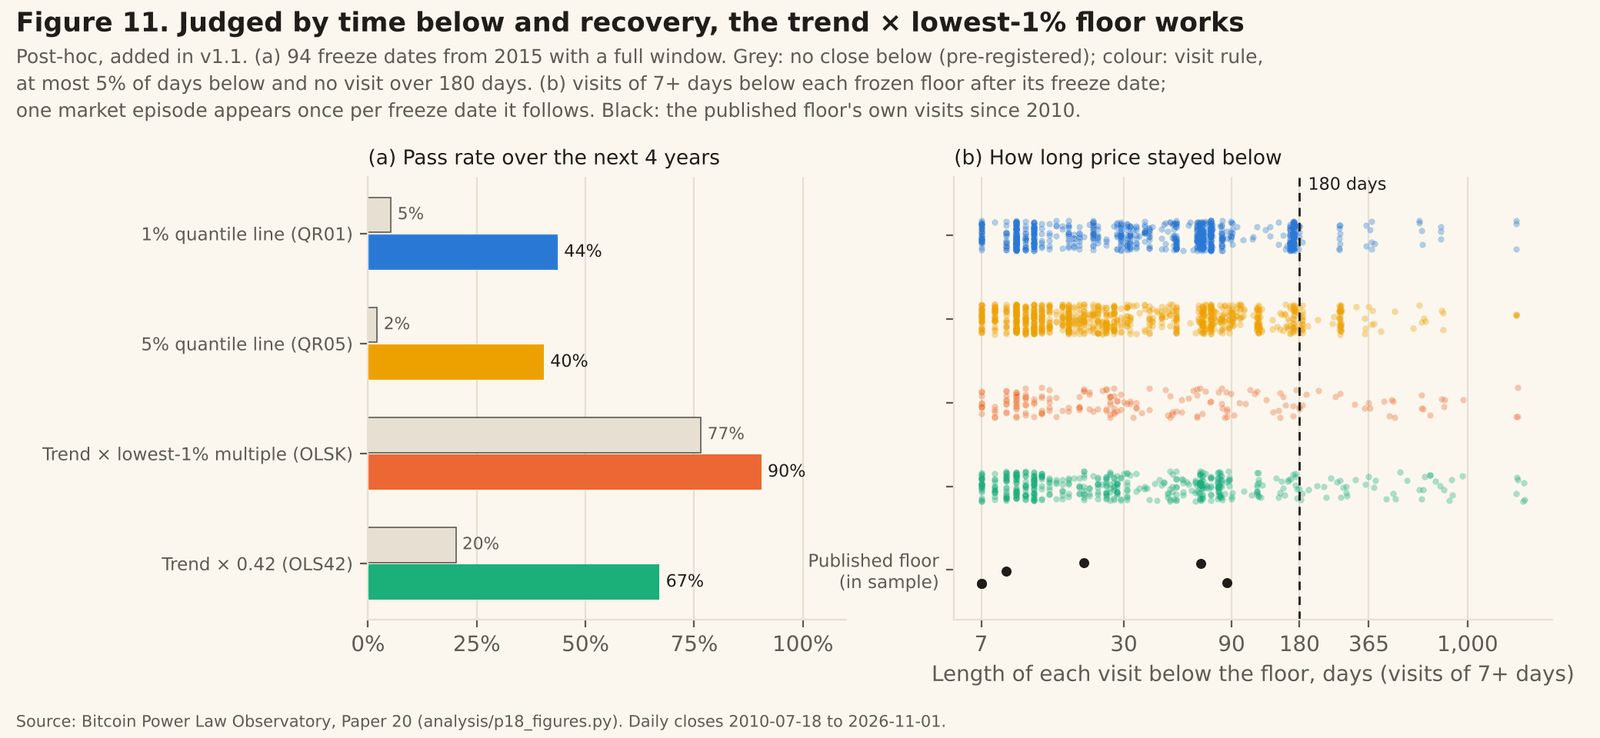
Most visits below every floor are short: a median of 25 to 42 days. The quantile lines fail mainly on time below, not on recovery. The published floor, fitted on the whole history, has the cleanest record of all: 3.7% of days since July 2010, in 23 visits, none longer than 86 days. Since 2016, 0.3% of days and a longest visit of 7 days.
This rule was proposed after the pre-registered results were known, so this section is a description, not a test. The test is forward.
What It Means
A floor is not a boundary. No definition tested here behaves like one out of sample. Even the most stable saw price close below it within four years at 23% of freeze dates.
It is a level price spends little time below. The published floor fits that on its own history, and the trend times its lowest-1% multiple fits it out of sample at 85 of 94 freeze dates (a post hoc result).
It is an estimate that moves. Every floor was revised once a full cycle was in the data: by a median of up to about a quarter, and by far more at single freeze dates. Present it with a revision history and a visit record.
The Forward Test
On 6 November 2026, before any data after 1 November was used, we fixed five floors at the 31 October close, plus the monthly-refit 1% line, and registered the same standard for them. Price started at 1.16× the published floor, 1.74× the trend floor and 1.10× the 1% line. It was already below the 5% line.
The first formal evaluation is in November 2027. The verdict comes when the window contains a full cycle. The status will be reported on this page as the record grows.
Read the Paper
22 pages, 11 figures. The pre-registration, all four floors across 172 freeze dates, the slope path, the forecast comparison, the curvature bootstrap, the visit analysis and the forward test.
A floor fitted on all of history describes the past. Frozen and carried forward, it is a level price visits rarely and leaves quickly, and that is how it should be judged.